ECG vs Echocardiogram: Key Differences, Uses, and What to Expect

When your healthcare provider recommends cardiac testing, understanding the purpose behind each exam is crucial for reducing anxiety and ensuring accurate results. Two of the most frequently ordered cardiovascular evaluations are the electrocardiogram and the echocardiogram. While they may sound similar and both involve placing sensors on your chest, an ecg vs echocardiogram comparison reveals that they measure entirely different physiological parameters. The electrocardiogram, commonly abbreviated as ECG or EKG, captures the electrical impulses that trigger your heart to beat, making it indispensable for identifying rhythm disturbances and acute ischemic events. Conversely, an echocardiogram utilizes ultrasound technology to generate real-time moving images of the heart’s internal structures, providing critical insights into pumping efficiency, valve function, and chamber dimensions. Understanding the distinct roles, procedures, and clinical applications of these two foundational tests empowers you to actively participate in your cardiovascular care. Whether you are experiencing unexplained palpitations, managing chronic heart failure, or undergoing routine preventive screening, knowing how an ecg vs echocardiogram evaluation differs and why cardiologists frequently order them in tandem will help you navigate your diagnostic journey with confidence and clarity. For comprehensive background information on heart testing, the Centers for Disease Control and Prevention (CDC) provides valuable patient education resources.
Understanding the Electrocardiogram (ECG/EKG)
The electrocardiogram remains one of the oldest, most reliable, and most accessible diagnostic tools in modern medicine. By mapping the heart's intrinsic electrical conduction system, clinicians can rapidly identify life-threatening arrhythmias, detect silent myocardial infarctions, and monitor the physiological impact of chronic conditions or pharmacological therapies.
Free calculatorLab Values Reference ChartComplete reference chart for medical lab valuesOpen the calculatorHow an ECG Works: Decoding the Heart's Electrical Language
Every heartbeat originates from a precise electrical cascade. The sinoatrial node acts as the heart's natural pacemaker, sending impulses through the atria, the atrioventricular node, the bundle of His, and finally the Purkinje fibers to coordinate ventricular contraction. An ECG records these voltage changes via surface electrodes placed strategically on the skin. The machine amplifies the tiny electrical signals and translates them into standardized waveforms: the P wave represents atrial depolarization, the QRS complex indicates ventricular depolarization, and the T wave reflects ventricular repolarization. By analyzing the amplitude, duration, and morphology of these waves, clinicians can pinpoint conduction blocks, ischemic changes, chamber hypertrophy, and electrolyte disturbances. This electrical mapping is highly sensitive to acute changes, which is why guidelines from the National Heart, Lung, and Blood Institute recommend an ECG as the first-line test in emergency settings when acute coronary syndrome is suspected.
The Step-by-Step Procedure & What to Expect
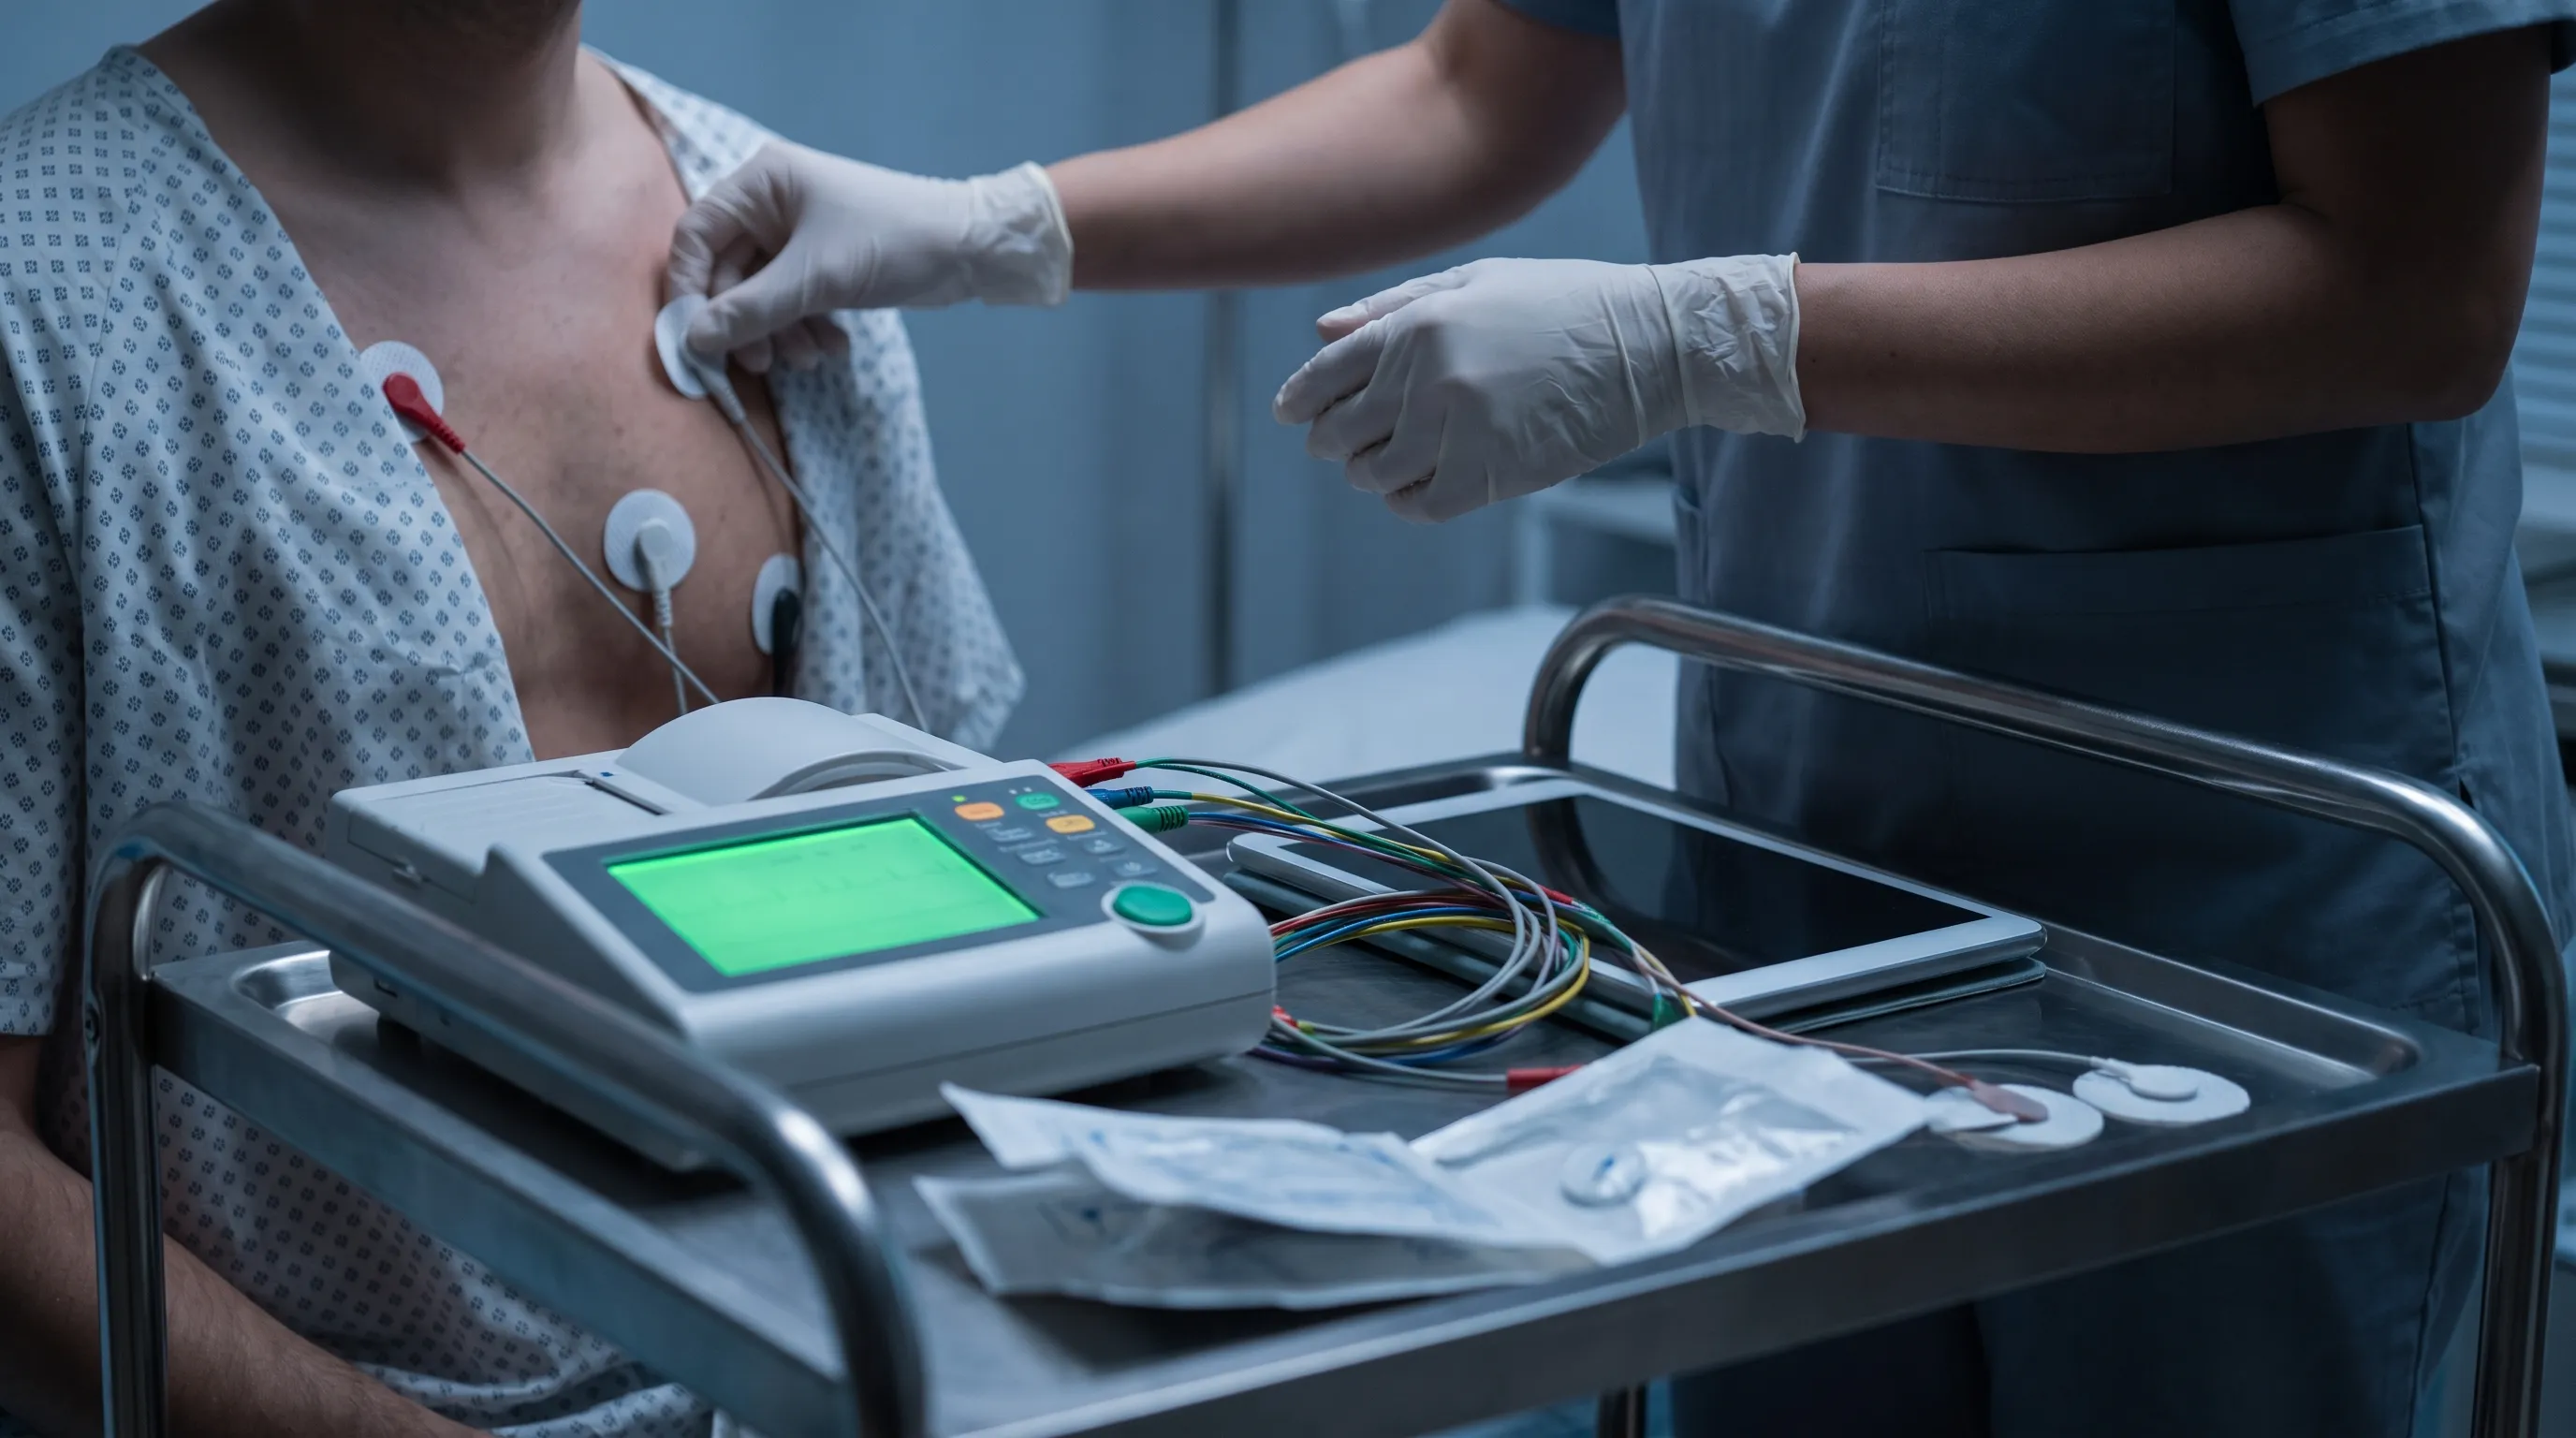
The ECG procedure is straightforward, non-invasive, and remarkably fast. You will typically be asked to lie flat on an examination table while a trained technician or nurse cleans small areas on your chest, wrists, and ankles. Mildly abrasive paper may be used to ensure optimal electrode contact, which can feel slightly cool but is never painful. Ten adhesive patches (six precordial leads on the chest and four limb leads) are attached, and wires connect them to a compact ECG machine. You must remain completely still and avoid talking during the recording, which usually lasts between thirty seconds and two minutes. The device detects voltage differences between electrode pairs without transmitting any electricity into your body, eliminating risks of shock or discomfort. Once the tracing prints or uploads digitally, the leads are gently removed, and any residual gel is wiped away. You can immediately resume normal activities without restriction.
Interpreting ECG Results: Waves, Intervals, and Clinical Signs
Reading an ECG requires systematic analysis. Clinicians first assess the heart rate, calculating whether it falls within the normal resting range of 60 to 100 beats per minute. They then evaluate rhythm regularity, checking if P waves consistently precede QRS complexes at uniform intervals. Deviations reveal critical diagnostic information. ST-segment elevation or depression can indicate acute myocardial ischemia or prior infarction. Prolonged QT intervals may signal susceptibility to dangerous ventricular arrhythmias or medication toxicity. Tall or peaked T waves often point to hyperkalemia, while flattened T waves suggest hypokalemia. Left ventricular hypertrophy manifests as increased QRS voltage, and bundle branch blocks appear as widened QRS complexes with characteristic notching. Importantly, as MedlinePlus clarifies, a structurally abnormal heart does not always produce ECG abnormalities. This limitation underscores why an ecg vs echocardiogram approach must be complementary rather than mutually exclusive.
Practical Patient Tips for Accurate ECG Readings
To ensure optimal ECG accuracy, follow these evidence-based preparation guidelines. Avoid consuming cold beverages or engaging in vigorous physical activity within thirty minutes of your test, as both can induce transient tachycardia or alter repolarization patterns. Inform your care team about all prescription medications, over-the-counter supplements, and herbal products, since diuretics, beta-blockers, antiarrhythmics, and certain antidepressants directly influence electrical conduction. If you have chest hair, ask the technician in advance about trimming the placement sites to improve electrode adhesion and prevent artifact interference. Wear a two-piece outfit to simplify electrode access. Finally, remain relaxed and breathe normally during the recording; anxiety-induced shallow breathing or muscle tremors can generate baseline interference that mimics pathological findings.
Demystifying the Echocardiogram (Echo)
While the ECG listens to the heart's electrical symphony, the echocardiogram watches its mechanical performance. By utilizing advanced sonographic imaging, cardiologists obtain detailed anatomical and functional data that directly guides long-term treatment strategies, surgical planning, and prognostic stratification.
Ultrasound in Action: Visualizing Structural & Mechanical Function
Echocardiography relies on the piezoelectric effect. A handheld transducer emits high-frequency sound waves (typically 2 to 5 megahertz) that penetrate the chest wall and bounce off cardiac tissues. Returning echoes are captured and converted into grayscale cross-sectional images by a computer processor. Because blood reflects sound waves differently than myocardial tissue, Doppler technology can be superimposed to visualize flow velocity and direction. This real-time imaging reveals wall motion abnormalities, valve leaflet morphology, septal defects, pericardial effusions, and intracardiac masses. The absence of ionizing radiation makes echocardiography exceptionally safe for serial monitoring across the lifespan, a critical advantage when tracking disease progression or therapeutic response.
Types of Echocardiograms: TTE, TEE, Doppler, and Stress Echo
Transthoracic echocardiography (TTE) represents the standard approach, accounting for over ninety percent of clinical studies. The technician applies acoustic gel and systematically sweeps the transducer across multiple acoustic windows, including the parasternal, apical, and subcostal views. When TTE image quality is compromised by body habitus, lung disease, or chest wall anatomy, a transesophageal echocardiogram (TEE) provides superior resolution. During TEE, a slender, flexible probe advances through the esophagus, positioning it directly behind the left atrium. This requires intravenous sedation, topical pharyngeal anesthesia, and several hours of pre-procedure fasting. Doppler echocardiography, integrated into both TTE and TEE, quantifies blood flow velocity to calculate pressure gradients across stenotic valves, regurgitant volumes, and cardiac output. Stress echocardiography adds pharmacological or exercise-induced workload to unmask ischemia, evaluating how wall motion changes under hemodynamic stress.
Key Echo Metrics: Ejection Fraction, Chamber Dimensions, and Valve Flow
Quantitative analysis forms the backbone of echocardiographic reporting. Ejection fraction (EF) measures the percentage of blood expelled from the left ventricle during systole, calculated by comparing end-diastolic and end-systolic volumes. The NHLBI classifies heart failure based on EF thresholds: preserved function at fifty percent or higher, mildly reduced between forty-one and forty-nine percent, and reduced at forty percent or below. Chamber dimensions are meticulously measured to identify dilatation or hypertrophy. Left atrial enlargement correlates strongly with atrial fibrillation risk, while right ventricular dysfunction often signals pulmonary hypertension. Valve assessment evaluates leaflet thickness, mobility, coaptation gaps, and calcification patterns. Doppler gradients differentiate physiologic flow from pathological stenosis, and color flow mapping identifies turbulent regurgitation jets. These metrics directly influence medication titration, device implantation decisions, and surgical referral timing.
Actionable Advice: Preparing for Your Echocardiogram
Preparation varies significantly by modality. For a standard transthoracic study, maintain your usual medication schedule and eat normally unless instructed otherwise. Wear loose-fitting, comfortable clothing that allows easy chest access. If you use inhalers or bronchodilators for asthma or COPD, bring them to the appointment, as technicians may ask you to use them to improve acoustic windows. For transesophageal echocardiography, arrange reliable transportation, as sedation will impair your ability to drive or operate machinery. Strictly adhere to the fasting protocol, typically six to eight hours for solids and two hours for clear liquids, to minimize aspiration risk during probe insertion. Remove dentures and notify your provider of swallowing difficulties, esophageal varices, or strictures that could complicate probe passage.
ECG vs Echocardiogram: Core Differences and When Each Is Used
Navigating an ecg vs echocardiogram decision requires understanding that these tests evaluate fundamentally different cardiac domains. They are rarely competitive; instead, they function as interlocking puzzle pieces that collectively construct a complete diagnostic portrait.
Side-by-Side Comparison Table
| Feature | ECG/EKG | Echocardiogram |
|---|---|---|
| What it measures | Electrical conduction pathways, rhythm regularity, and depolarization-repolarization cycles | Structural anatomy, valve mechanics, chamber geometry, and systolic-diastolic pumping function |
| Technology | Surface electrodes detecting microvolt electrical differentials | High-frequency pulsed ultrasound waves with real-time image reconstruction and Doppler flow analysis |
| Radiation Exposure | None | None |
| Invasiveness | Completely non-invasive; external skin contact only | Non-invasive for TTE; minimally invasive for TEE requiring esophageal intubation |
| Procedure Duration | Two to five minutes | Thirty to sixty minutes for comprehensive TTE; longer for TEE |
| Primary Clinical Indications | Palpitations, syncope, acute chest pain, preoperative screening, medication monitoring, arrhythmia detection | Heart failure classification, valvular stenosis or regurgitation, congenital anomalies, cardiomyopathy, endocarditis evaluation |
| Diagnostic Output | Time-based voltage waveform tracings (P, QRS, T segments, PR and QT intervals) | Two-dimensional/three-dimensional moving video loops, M-mode motion curves, color and spectral Doppler hemodynamic maps |
Clinical Applications: Arrhythmias vs Structural Disease
The electrocardiogram excels at identifying electrical instability. Atrial fibrillation, ventricular tachycardia, supraventricular tachycardia, and advanced heart block are primarily diagnosed through continuous or resting ECG monitoring. Holter monitors and event recorders extend this capability to ambulatory settings, capturing paroxysmal arrhythmias that evade snapshot testing. In contrast, echocardiography dominates structural diagnostics. It quantifies the severity of mitral regurgitation, measures aortic valve area in stenosis, visualizes pericardial tamponade, and detects ventricular septal defects. While an ECG might show nonspecific T-wave inversions suggesting ischemia, only an echocardiogram can demonstrate regional wall motion abnormalities confirming localized myocardial injury. Recognizing these distinct strengths ensures appropriate test selection based on presenting symptoms.
Why They Are Complementary, Not Competing
The American Heart Association consistently emphasizes integrated diagnostic algorithms. An ECG provides immediate rhythm assessment and ischemic screening but cannot quantify mechanical efficiency. Conversely, an echocardiogram reveals pump failure and valve pathology but cannot reliably detect paroxysmal conduction disturbances. In heart failure management, for instance, the ECG may display left ventricular hypertrophy patterns or bundle branch blocks, while the echo precisely measures reduced ejection fraction and guides guideline-directed medical therapy. Following myocardial infarction, the ECG localizes the affected coronary territory, whereas the echo evaluates the extent of viable myocardium, identifies mechanical complications like papillary muscle rupture, and tracks recovery. When weighing an ecg vs echocardiogram approach, clinicians prioritize them based on acute symptomatology, then layer the secondary test for comprehensive evaluation.
The Diagnostic Workflow: How Cardiologists Combine Both Tests
Understanding how specialists sequence and interpret these studies clarifies why your provider may order both within a single care episode. The integration of electrical and structural data reduces diagnostic uncertainty and optimizes therapeutic targeting.
Acute Care Scenarios: Chest Pain and Suspected Heart Attack
When a patient arrives with acute chest pain, diaphoresis, and dyspnea, protocol dictates rapid ECG acquisition within ten minutes of emergency department triage. ST-segment elevation mandates immediate catheterization activation, bypassing extensive imaging. However, once reperfusion therapy concludes, clinicians transition to echocardiography to assess infarct size, residual ischemia, and hemodynamic stability. Non-ST-elevation acute coronary syndromes utilize the ECG for risk stratification, followed by echocardiography to rule out alternative diagnoses like aortic dissection or pulmonary embolism. This sequential workflow exemplifies how ecg vs echocardiogram testing bridges emergency stabilization and definitive characterization.
Chronic Management: Heart Failure and Valvular Disorders
In outpatient settings, longitudinal monitoring relies heavily on echocardiography. Patients with newly reduced ejection fraction undergo baseline echo, followed by repeat imaging after ninety days of guideline-directed pharmacotherapy to determine device candidacy. Annual or biennial echocardiographic surveillance tracks valvular progression, prompting surgical intervention before irreversible ventricular remodeling occurs. The ECG complements this by detecting emerging conduction delays that necessitate pacemaker or biventricular pacing upgrades. Medication adjustments often hinge on both electrical stability and mechanical performance, reinforcing the necessity of combined testing.
Navigating False Positives, False Negatives, and Limitations
No diagnostic modality is infallible. ECG interpretation suffers from low specificity in certain populations; early repolarization patterns in young athletes or baseline ST-T changes in women can mimic ischemia. Body habitus, lung hyperinflation, and chest wall deformities degrade ECG signal quality and obscure echocardiographic windows. Echocardiography heavily depends on operator expertise and acoustic access; suboptimal imaging may require contrast enhancement or advanced modalities like cardiac MRI. Recognizing these limitations prevents overdiagnosis and ensures appropriate escalation to alternative imaging when initial ecg vs echocardiogram results prove inconclusive.
Safety, Risks, and Recovery Considerations
Both tests rank among the safest diagnostic procedures available, but understanding their risk profiles enhances informed consent and post-procedure confidence.
Radiation Exposure and Invasiveness Myths Debunked
Contrary to popular belief, neither the electrocardiogram nor the standard echocardiogram utilizes ionizing radiation. The ECG passively records endogenous bioelectricity, while echocardiography employs mechanical sound waves. Decades of clinical use confirm no cumulative tissue damage, carcinogenic risk, or reproductive harm from repeated examinations. TEE introduces mild procedural risks, primarily oropharyngeal trauma, transient dysphagia, or rare sedation-related respiratory depression. These are mitigated through sterile technique, real-time hemodynamic monitoring, and board-certified anesthesia oversight. Patients can confidently undergo serial monitoring without radiation exposure concerns.
Post-Procedure Care and Follow-Up Monitoring
Following a standard ECG, patients resume normal routines immediately. Electrode sites may experience mild erythema from adhesive sensitivity, easily managed with gentle cleansing and hypoallergenic moisturizers. After transthoracic echocardiography, acoustic gel washes off effortlessly, and no activity restrictions apply. TEE requires extended recovery; patients remain under observation until sedation wears off and protective airway reflexes normalize. A sore throat persists for twenty-four to forty-eight hours, managed effectively with cool fluids, lozenges, and acetaminophen. Patients should avoid hot foods or straws initially to prevent esophageal irritation. Follow-up scheduling depends on baseline pathology, with cardiologists reviewing combined ECG-echo reports to adjust pharmacotherapy, recommend lifestyle modifications, or coordinate interventional planning.

Navigating Costs, Insurance, and Access
Understanding the financial and logistical aspects of ecg vs echocardiogram testing empowers patients to navigate healthcare systems efficiently and minimize unexpected out-of-pocket expenses.
Typical Cost Ranges and Insurance Coverage Guidelines
In the United States, facility fees, physician interpretation charges, and geographic variations significantly influence pricing. A standard resting ECG typically ranges from fifty to two hundred dollars, while comprehensive transthoracic echocardiography averages between two hundred and one thousand dollars. Transesophageal studies, requiring sedation and specialized equipment, often exceed one thousand five hundred dollars. Medicare and most private insurers classify both tests as medically necessary when indicated by symptoms, abnormal physical findings, or guideline-supported chronic disease monitoring. Prior authorization is rarely required for initial studies but may apply for frequent repeat testing without documented clinical change. Patients should verify network coverage, understand deductible impacts, and request itemized cost estimates to avoid billing surprises.
Questions to Ask Your Provider and Care Team
Proactive communication streamlines the diagnostic process. Essential inquiries include: Why is this specific test recommended over alternative modalities? Will insurance cover both ECG and echocardiogram if ordered simultaneously? Should I hold any cardiac medications prior to testing? How will abnormal results be communicated, and what follow-up steps are anticipated? Will I need a stress component or contrast enhancement? Requesting written educational materials or directing you toward patient-facing video resources from institutions like the Mayo Clinic or Cleveland Clinic enhances comprehension and adherence. Building a collaborative relationship with your care team ensures transparent decision-making and reduces procedural anxiety.
Frequently Asked Questions
Can a normal ECG rule out heart disease?
No. The National Institutes of Health notes that many structural heart conditions do not produce specific ECG changes. A resting ECG primarily evaluates electrical rhythm and acute ischemia. Structural issues like valve disease, early-stage heart failure, or mild congenital defects often require an echocardiogram for accurate diagnosis.
Does an echocardiogram involve radiation?
No. Echocardiography uses high-frequency sound waves (ultrasound), which means it exposes patients to zero ionizing radiation. It is considered exceptionally safe for repeated use across all age groups, including pregnant individuals and pediatric patients.
How long does it take to get results from both tests?
ECG tracings are typically generated instantly and can be interpreted by a physician within minutes. Echocardiogram results require image processing and detailed measurement by a sonographer and interpreting cardiologist, which usually takes 24 to 72 hours depending on clinical urgency and facility workflow.
Can I exercise or eat before an ECG or echocardiogram?
For a standard resting ECG, light meals are generally acceptable, but you should avoid vigorous exercise and cold beverages immediately beforehand, as they can temporarily alter heart rate and electrical readings. For a standard transthoracic echocardiogram, no fasting is required. Transesophageal echocardiograms require 4 to 8 hours of fasting due to sedation.
Is one test more accurate than the other?
Neither test is universally more accurate because they evaluate different physiological domains. The ECG is the gold standard for detecting electrical abnormalities and acute coronary events. The echocardiogram is the definitive tool for assessing structural integrity, pumping function, and hemodynamics. Cardiologists rely on both for comprehensive cardiovascular evaluation.
Conclusion
The ecg vs echocardiogram discussion ultimately converges on a fundamental principle in modern cardiology: electrical and structural assessments are interdependent, not interchangeable. An electrocardiogram delivers rapid, precise insights into rhythm disturbances, conduction abnormalities, and acute ischemic changes, making it indispensable for emergency triage and longitudinal electrical monitoring. An echocardiogram provides unparalleled visualization of cardiac anatomy, valve mechanics, chamber remodeling, and hemodynamic efficiency, directly shaping chronic disease management and interventional planning. When evaluating an ecg vs echocardiogram strategy, recognize that optimal cardiovascular care frequently demands both. A normal ECG never definitively excludes structural pathology, just as a structurally normal echo cannot guarantee electrical stability. By collaborating with your healthcare provider, adhering to preparation guidelines, and understanding how these complementary tests illuminate different facets of heart function, you take a proactive, informed approach to lifelong cardiovascular wellness. Always consult licensed cardiology professionals for personalized diagnostic recommendations and treatment pathways tailored to your unique clinical presentation.
How we work
Researched and drafted with AI assistance, then reviewed by a human editor against the cited sources.
This article is general health information, not medical advice. Consult a qualified healthcare professional about your own situation.